Programs: Monitoring

In order to assess the Severn’s water quality we established a monitoring program throughout the summer months, in which we monitor 15 sampling stations every one to two weeks. We stress measurements of dissolved oxygen as this is a major threat to habitats in this area of the Bay. We also test for salinity and water clarity, and record temperatures. The Program is supervised by Dr. Pierre Henkart. You can read our complete, detailed monitoring reports here:
The monitoring results for Dissolved Oxygen, Salinity & Temperature, and Water Clarity are summarized below.
In addition to the water quality measurements, we also monitor yellow perch larvae in the upper Severn in the spring in collaboration with the Maryland Department of Natural Resources (DNR) and Arlington Echo Outdoor Education Center.
Monitoring Results: Dissolved Oxygen

The principal focus of the 2006-2008 Severn Riverkeeper Monitoring Projects was to assess the levels of dissolved oxygen (DO) throughout the tidal Severn River. A series of monitoring stations in both the mainstem and selected creeks was established in 2006, and these have been monitored every 1-2 weeks throughout the following three summers.
Our monitoring is carried out with YSI-85 meters that have an oxygen probe suspended on a cable, allowing us to obtain quantitative measurements every 1-2 meters between the bottom and the surface. The resulting DO depth profiles always show higher DO levels near the surface where there is exchange with atmospheric oxygen, and decreasing DO with depth. These profiles allow us to assess oxygen available in two different biological habitats: (1) the benthic (bottom) habitat occupied by oysters, clams, and worms; (2) the entire water column occupied by fish and other freely swimming organisms.
The Severn Dead Zone — Benthic organisms are adapted to low oxygen conditions, and many will tolerate DO levels of 1 mg/liter. However, DO levels below 0.2 mg/liter are characteristic of anoxic “dead zones,” and these conditions will kill even tough benthic organisms. In the Chesapeake Bay mainstem, such anoxia develops every spring in deep water, and persists until autumn. However, true dead zones have not been previously described in shallow tidal tributaries such as the Severn.
As seen from the chart at left, our monitoring has revealed persistent bottom anoxia each summer in the northern Round Bay area of the Severn. This anoxia occurs in the bottom 3-6 feet of water of the affected area, where the depth is 20-25 feet. This dead zone occupies several square miles of bottom. We also generally find another smaller dead zone in Asquith Creek, in 10-14 feet of water. This creek has a small local watershed, but water exchange with the adjacent Severn is restricted by a shallow SAV-covered bar across its mouth.
Further confirmation of bottom anoxia at the stations showing very low DO readings on our meters was provided by using a sampling device to obtain water from 0.5 meters above the bottom. When brought into the boat, water with DO < 0.2 mg/liter routinely smelled strongly of hydrogen sulfide, a product of anaerobic bacterial metabolism. Since hydrogen sulfide is unstable in the presence of oxygen and is only produced when oxygen is unavailable, these observations are independent confirmation of anoxic conditions.
In conclusion, our monitoring has revealed the first example of a shallow water dead zone in the Chesapeake. In a substantial area of Round Bay and the upper Severn, benthic organisms die off each summer, depriving crabs and some fish of an important component of their food chain. This dead zone is persistent over many weeks of the summer, and should not be confused with the temporary anoxia that sometimes occurs in creeks and gives rise to fish kills. The Severn did experience such an event in Weems Creek in 2007. These short-term anoxic episodes are caused by phytoplankton blooms that generate oxygen during daylight but consume it at night, and fish trapped in such creeks sometimes cannot escape and die. However these brief periods of anoxia do not generally kill benthic organisms in the creeks, and fish will repopulate these areas.
It is not clear whether the summer-long bottom anoxia that occurs in the Severn is caused by high nutrient loading from the local watershed, or because of restricted water circulation. Oxygen-depleted bottom water will become re-oxygenated by vertical mixing with surface water, or by horizontal exchange with more oxygenated water from the adjacent Chesapeake (as found in the lower Severn). The Asquith Creek dead zone is almost certain to be caused by limited mixing and exchange, but the Round Bay dead zone could be a combination of both nutrient loading and limited mixing. One of our future goals is to resolve this question by analyzing the Severn’s nutrient loading.
The Hypoxic Habitat Squeeze — Fish can swim away from water with low amounts of dissolved oxygen, so although they will not be able to feed on bottom organisms, the anoxia described above will not kill them. However, they have higher metabolic rates than benthic invertebrates, and they are much less tolerant of low DO levels. The Chesapeake Bay Program has set a DO of 5 mg/liter as a criterion of acceptable water quality.for fish, and our monitoring data reveals that DO levels of less than 5 mg/liter are virtually always encountered in the summer as our probes are lowered from the surface. Thus fish will not utilize the hypoxic water at lower depths where oxygen levels are not acceptable.
This figure of our monitoring data illustrates this hypoxic habitat squeeze, displaying DO levels vs depth at the Route 50 Bridge station throughout the summer of 2008. A fish with a tolerance of 5 mg/liter DO will be able to use the entire water column only on September 30, while on June 17 it will be able to use only the upper 2 meters. This habitat squeeze deprives fish of much of the Severn’s water during the summer.
The hypoxia driving this squeeze is driven by the same excess of nutrients that cause the more extreme bottom anoxia described above, but the chart at the left shows that there is not a strict correlation of the areas affected. The reason that the Joyce station has a low percent of water with DO>5mg/liter is that it is deeper than the other stations, and the deeper water is all hypoxic. The stations in the lower Severn appear to benefit from greater exchange with the better mixed waters of the adjacent Chesapeake.
Monitoring Results: Salinity (& Temperature)
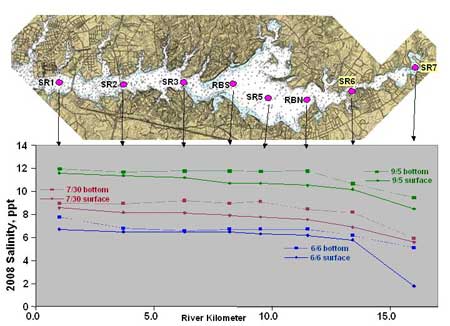
The Severn’s salinity is dominated by the salinity of the adjacent Chesapeake, which reflects a balance between fresh water coming down the Bay from the Susquehanna River and denser salty water moving up the Bay near the bottom. Because the Susquehanna flow varies throughout the year, the Severn’s salinity shows a yearly variation as depicted in this figure from the Maryland DNR website. The minimum salinity occurs in the spring and the fall maximum averages 11-12 parts per thousand, which is about 1/3 of seawater. The low salinity for much of the summer means that the Severn does not contain many marine fish species that frequent the saltier lower Chesapeake. It also means that the Severn is a good place for oyster restoration because organisms that cause oyster disease do not flourish at these low salinities, while oysters can still grow.

Our monitoring data show surprisingly uniform salinity throughout most of the length of the Severn. Near the tidal head of the Severn, fresh water can be detected coming from Severn Run, but this influence is quickly diminished as one moves towards Round Bay. Unlike the Chesapeake, there is generally only a small difference in the Severn’s bottom and surface salinity. This salinity data argues that the Severn is more of an elongated bay off the Chesapeake than a river or even a subestuary.
An interesting salinity pattern develops in the Severn each spring and after storms bringing several inches of rainfall to the region. We monitored after such a storm in June 2006, when we found the expected initial salinity drop at the uppermost Severn stations near Severn Run.
However, a few days later a much greater volume of fresh water from the Susquehanna arrived in the Chesapeake off Annapolis and pushed up into the lower Severn. This caused the Severn’s heavier saltier water to drain out into the Chesapeake until the Severn again attained the kind of uniform salinity seen in the above figure. An annual spring “salinity reversal” with saltier water temporarily occupying the upper Severn is described in this DNR website by its monitoring team. These measurements attest to the dominant influence of the nearby Chesapeake over the Severn’s salinity, with the local watershed contributing a measurable but minor influence in the overall salinity budget.
Our monitoring programs have routinely obtained temperature measurements along with salinity and dissolved oxygen monitoring data. In the early summer, surface water is much warmer than bottom water due to solar heating. Such warmer surface water has a lower density than the cooler bottom water, giving rise to a stable layering effect that retards vertical mixing. This restricted vertical mixing in turn prevents hypoxic bottom water from returning to the surface to become re-oxygenated by atmospheric oxygen. As the summer progresses, the bottom water in the relatively shallow Severn becomes warmer and the density gradient becomes weaker. Thus a strong storm can more readily stir up the Severn’s waters in September than June. However, such storm-driven mixing has not occurred during the summers of 2006-2008 when we have monitored the Severn.
Monitoring Results: Water Clarity and Submerged Aquatic Vegetation

Oceanographers use several measures of water clarity, but monitoring groups in the Chesapeake mostly use the crude but reliable Secchi disk. This disk is lowered from a boat, and the greatest depth at which its image is barely visible is recorded. We have monitored Secchi depths throughout the Severn and its creeks, and have found a range of between 0.2 meters (only about 8 inches, in silty water near Severn Run after a storm) to over two meters in Round Bay in August. Water clarity can be obscured by stirred-up silty sediments, but also by microscopic phytoplankton whose growth is fostered by nitrogen- and phosphorous-based nutrients in the water. We have no simple means to dissect these factors.

Good water clarity is vital for the growth of submerged aquatic vegetation (SAV), which is a critical habitat for fish and crabs. SAV in the Severn is comprised of several species of rooted plants growing in shallow water that are annuals, sprouting from roots or seeds each spring. If the water is not clear, their leaves will not obtain adequate light for levels of photosynthesis needed for the plants to grow and reproduce.
Although historically the Severn had SAV growth all along its shores, it died off completely in the Severn in the 1970s. The re-growth of the Severn’s SAV beds began spontaneously in the 1990s in the mid-Severn/Round Bay region, and this area has made the Severn a “poster child” for SAV recovery, with the best SAV growth in the mid-Chesapeake.
The Severn’s SAV growth received a major set-back in 2000 due to a massive spring dinoflagellate bloom, but has since recovered. However, as shown in the map above, SAV recovery has been confined to the mid-Severn, with minimal growth in the lower Severn below the Route 50 bridge and negligible growth above Round Bay.
Understanding what limits SAV growth within the Severn may provide insights into why neighboring tributaries like the South, West, and Rhode rivers have little or no SAV growth. The figure above combines aerial mapping of SAV beds by the Virginia Institute of Marine Science and our water clarity measurements, showing a clear correlation between water clarity in mid-Severn and SAV growth along the shore.
Given the requirement for sunlight to power photosynthesis, this correlation is not surprising. However, the factors that restrict water clarity may be different in the upper and lower Severn, and we need to understand this issue in order to know how to encourage SAV growth in these areas.

SAV growth in Severn Creeks has been generally poor, although horned pondweed (Zannichellia palustris, photo, right), a spring-growing species, can usually be found in May and June. Secchi readings in the creeks are almost always lower than readings in the adjacent mid-Severn, so the creeks may be considered similar to the upper Severn. The one exception is Asquith Creek, which shows SAV growth all along its shores and also a majority of Secchi depth readings greater than one meter.
Monitoring Results: Yellow Perch

Yellow perch are a fresh water species that has adapted living in the fresher parts of estuaries like the Chesapeake, and this fine-tasting fish has traditionally been found in good numbers in the Severn.
During the 1930s the Maryland Department of Natural Resources (DNR) maintained a hatchery for yellow perch in Severn Run. Unfortunately, in the 1960s the Severn’s yellow perch population began to decline, and in 1989 the population became so low that the DNR closed the Severn to yellow perch fishing.
Several attempts have been made to re-stock the Severn with yellow perch fry, but the population remains very low, with no visible prospects of increase. Some adult yellow perch remain in the Severn, and small schools can be seen migrating up into fresh water in Severn Run in the spring. Egg masses can be found along the stream banks, but few juveniles turn up later in the year in the upper tidal Severn where they were traditionally found.

In an attempt to understand why yellow perch reproduction is so poor in the Severn, biologists from DNR Fisheries undertook a program of monitoring larval yellow perch returning to the tidal Severn after hatching in Severn Run. These 5-10mm larvae can be captured using a plankton net, and monitoring protocol consisting of a standardized series of plankton tows was established in the upper tidal Severn.
By monitoring twice a week from late March until early May, an indication of successful hatching was obtained. When declining DNR funds threatened to end this monitoring program, the Severn Riverkeeper Program collaborated with the Arlington Echo Outdoor Education Program and DNR to continue the program starting in 2007. The monitoring data show detectable larval recovery, but at a level considerably less than was found in the 1960s. The year 2008 was particularly poor for larval production, not only in the Severn, but also in neighboring tributaries such as the South River.
DNR Fisheries scientists are continuing to try to understand the causes of poor yellow perch reproduction in the Severn. They have considered adult stress caused by summer hypoxia, and habitat squeeze due to greater saltwater intrusion into the upper Severn as major candidate explanations.